MAKING GAMES
LiveOps at Behaviour: The Value of Data
Germany’s Making Games magazine recently profiled Live Operations at Behaviour Interactive and we are republishing that series here with permission. In this second article, our Data Science Lead, Julien Céré, looks at the many ways data influence LiveOps at Behaviour.
Julien Céré leads the Data Science team at Behaviour Interactive. He oversees scientists working on AI and statistical models and develops partnerships with academic researchers. Julien has a background in ecology and animal behaviour and is pursuing a PhD on the evolution of social behaviour (e.g. altruism) using video game data.
Games as a service are real ecosystems with myriad interconnected moving and evolving parts. LiveOps teams cannot be blind, and data-informed insights can both help minimize the risks of their decisions and show unseen opportunities.
At Behaviour, we draw a clear line between data-informed and data-driven decisions. The former still welcome some creativity, instinct and risk in the decision-making process, whereas numbers and KPIs dictate data-driven decisions. In both cases, however, LiveOps teams must rely on accurate information about what is going on in the game to reach the best decision possible.
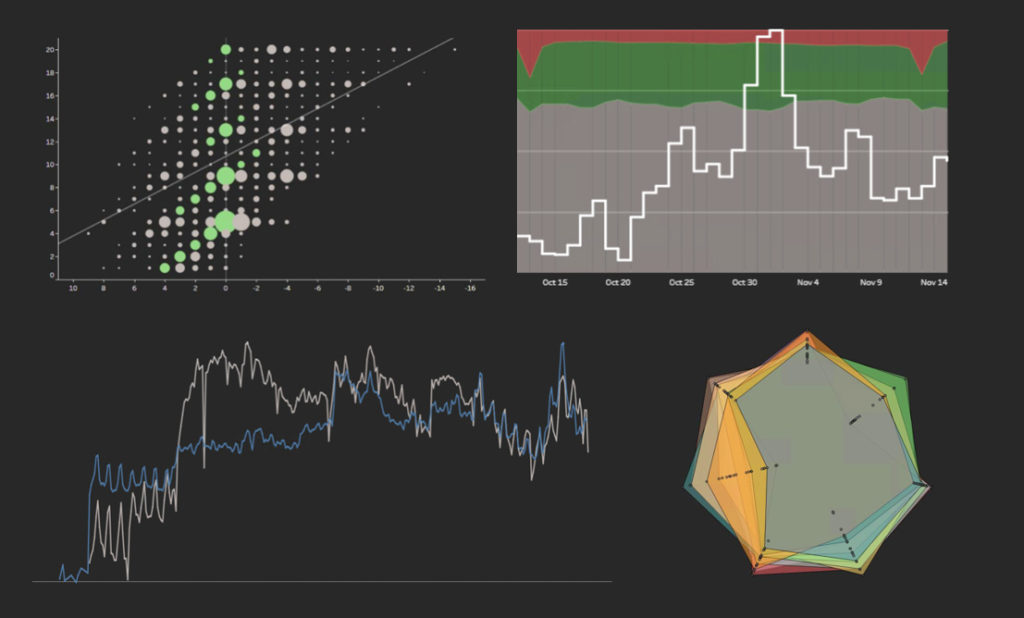
The best window on a live video game is a live data dashboard. Great dashboards don’t only present data to teams but empower them to be autonomous in their findings. Designing and sustaining a live dashboard constellation requires multidisciplinary teams that regroup data analysts, data developers, data scientists and user research specialists.
The speed at which dashboards are designed, created and updated directly impacts the velocity at which the LiveOps teams can iterate on game balancing and game economy. At Behaviour, the LiveOps teams have access to a wide catalogue of live dashboards that are updated daily. These dashboards cover topics like KPIs (acquisition, retention, monetization), gameplay-related data (game balance, game economy), tech issues (bugs and crashes), and marketing data. We are able to monitor game behaviour on all platforms that run our games. FPS, loading times and memory consumption are metrics that we follow closely to allow the best experience possible on every platform.
Any useful dashboard is a response to a need or a challenge facing the production team or LiveOps team. Translating a question into a self-explanatory series of visualizations and analysis is the speciality of our data analysts. For example, we’ve designed different dashboards that monitor game balance across maps for level designers and across characters for gameplay designers. All our dashboards allow for long-term monitoring as well as some breakdown (by platforms, countries, game styles, characters, and maps, etc.) for further exploration.

Every finding can shift our development process. Data often leads to useful findings. For example, we once discovered that our daily quests were not efficient. Most of our players did not complete them, which was impacting the game’s economy. Players had to do a lot more to earn the equivalent resources from daily quests, which impacted the overall experience. We raised the issue, and our game-design team fixed it.
The raw material for creating a dashboard is the data. Useful data can be obtained from multiple sources like in-game analytics, out-game analytics, user and consumer opinions or public data. Any new in-game analytic is designed and programmed along with its relevant feature and goes through a series of validation steps. This approach does require an additional time cost and a clear understanding of the future insight needs around a new feature. Still, we found that this investment ensures better quality data (easier extract-transform-load, or ETL) and earlier insights for the decision teams.
The use of in-game analytics is only possible with a reliable data pipeline. Hence, the focus of our data developers is to provide our analysts and scientists with timely access to the game data and to ensure data quality. The data developers also orchestrate the anonymization of our data so that we are GDPR compliant and can therefore keep our data for a longer period since many analyses require us to go back in time.
Unfortunately, dashboards cannot answer every single question. Data analysts and scientists often perform targeted ad hoc analyses that yield insights not covered by our dashboards. Velocity in ad hoc analysis is key to addressing issues before they get out of hand. In one instance, we were able to rapidly tweak unbalanced perks thanks to a statistical analysis of their impact on one’s win ratio.
Our community’s perception of our games is monitored as closely as in-game analytics. After every update, our user research specialists reach out to the player community and get feedback through customer satisfaction surveys (CSATs). These surveys are particularly popular in our community, and we usually get more than 100,000 responses. We also organize regular playtests and focus groups which are useful to test the reception of future DLCs/products, new features and live design tweaks.
Perception issues and feedback are addressed as seriously as technical crashes. Data sampling is key to any reliable and solid analysis, but it is particularly important for qualitative data. Some objectives require input from hardcore players (e.g. new characters) while others need fresh eyes (e.g. branding). Hence, along with our player community, we invest in a squad of dynamic volunteer playtesters (not necessarily players of our games) who can test a prototype build or answer a survey on an aspect of the industry (e.g., Cross-Play) on fairly short notice.

Julien Céré
Data Science Lead


